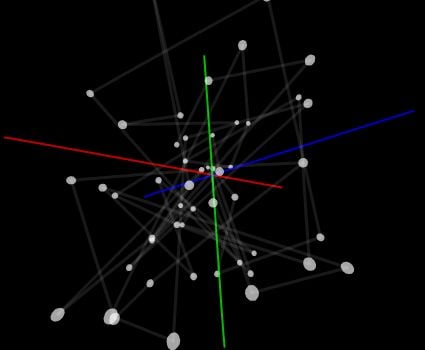
Creating 3D chart in Papervision 3D
Papervision 3D is one of the most interesting ways to visualize data. We can can use the three dimensional lines to create interactive 3d charting, modeling, or graphing components.
This example shows a really basic rotating 3D chart. There are two important things that it shows.
1) A three dimensional scatter plot.
2) A three dimensional line chart
Here’s the example:

You can view this application in a new window at: Line3DChart.
You will find the code that makes it work here

